An introduction to Monzo’s data stack
Originally posted on Data@Monzo Medium
The modern data stack is a collection of rapidly evolving technologies that together provide a platform for analytics.
While we at Monzo already have quite a modern data stack, there is always more to learn and room for improvement. This post summarises the core components of our modern data platform, some of the challenges we currently face, and what we want to change.
We follow two principles to guide our choices on the data platform and how we structure our data team:
- Centralised data management
- Decentralised value creation
Centralised data management allows companies to have a 360 degree view of their customers and their business. It unlocks data-driven decision making which is key to competing in today’s markets. Next to having all the data in one place, centralised data management also enables organisational efficiencies. Many data operations and data governance problems become a lot easier to solve if everyone in a company treats data in the same way.
Decentralised value creation means we have a discipline of data folks that work embedded across the entire company. This is sometimes known as a hub and spoke model. The teams closest to the problem space are the ones creating their data products.
An overview of our data architecture

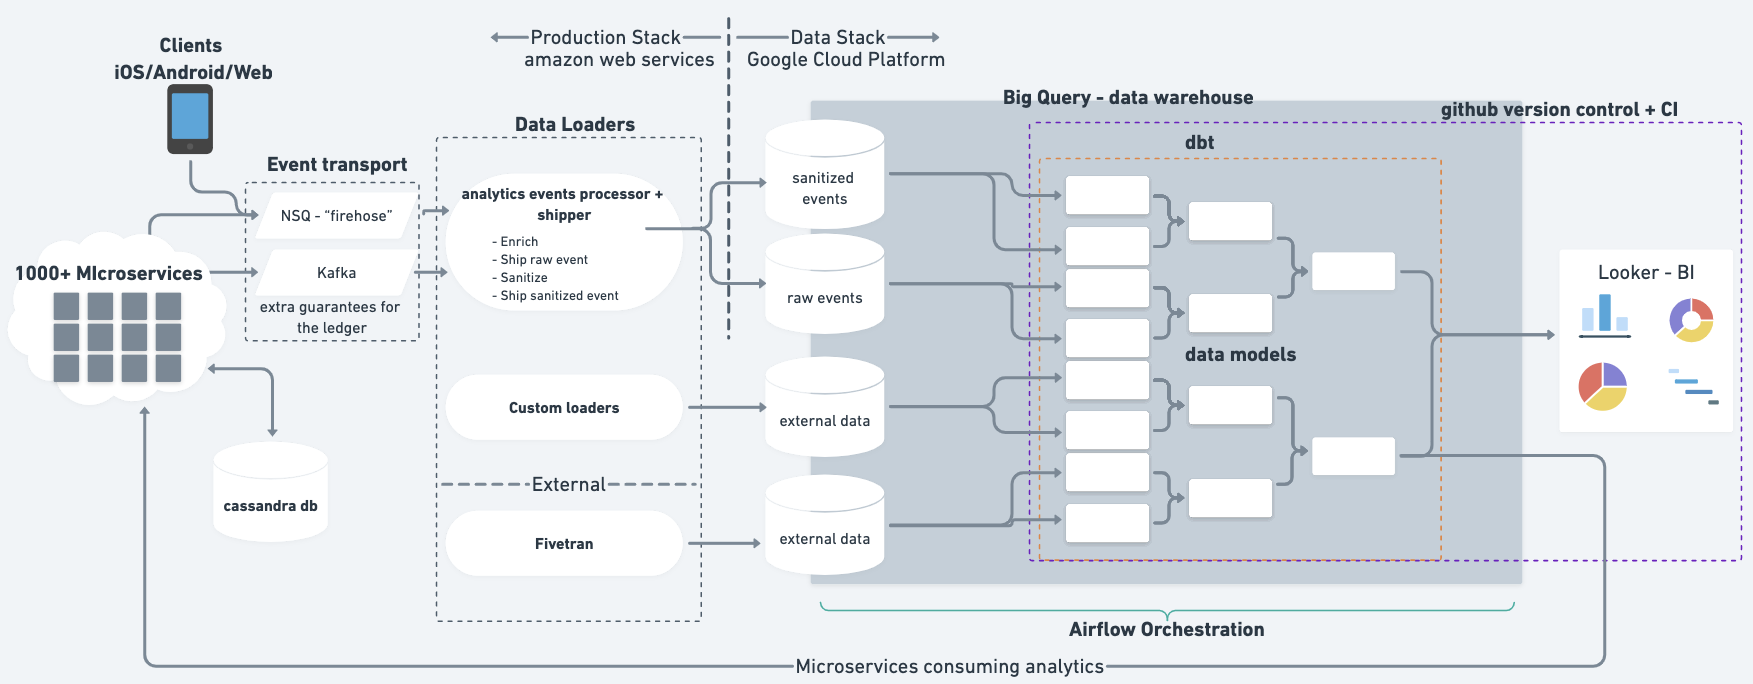
At a very high level, most of our data is in the form of event data being produced in our backend services. These events are streamed via ‘the firehose’ (using Kafka and NSQ) to specific append-only projects in BigQuery.
Data developers create data pipelines from these events using dbt (by dbt Labs, formerly Fishtown Analytics). We use dbt to incorporate software engineering best practices into our data work.
Once a data developer has created a pipeline, they also create dashboards and get insights in Looker. It’s worth expanding on what we mean by ‘data developer’ here. Most of the data work is done by the data discipline, however anyone in the company can jump into the data pipelines and make dashboards. For a more detailed view of how we empower people to use data check out Borja’s post.
Let’s dive a little deeper into each component and where we’re going with it.
Data loaders #
Analytics Event Processor and Shipper is a tool we built that takes events from backend services posted onto the firehose, and analytics events from the app or internal tooling. There are two microservices involved:
- Analytics Event Processor consumes two NSQ topics
firehoseandclient_analytics. The Processor then enriches the payload of the event. For example, an event containingaccount_idis expanded into an account object. Then the Processor sanitises the payload to remove personally identifiable information (PII). - Analytics Event Shipper is responsible for writing both sanitised and raw events to BigQuery event tables. It creates BigQuery tables as necessary.
It’s worth noting that the event tables in BigQuery have a column for the payload. This allows the schema to change. A data developer can then extract columns using JSON_EXTRACT functions in BigQuery.
We use Fivetran for loading data from several systems, including for our accounting and web analytics data.
We also load a few miscellaneous bits of data, for example data dumps from third parties directly loaded into BigQuery or Google Cloud Storage. However, we aim to keep bespoke approaches to a minimum.
A challenge we face, particularly with our events data is ownership. Frequently, teams that generate the event data in our production stack are not the teams consuming the data. When a data developer picks that event data up in BigQuery, they may not have all of the domain context and the data can have many issues, for example all the data needed for particular analysis needs. Not knowing who to contact about the data slows us down. We will solve this by having clear ownership of all our data, from our production stack to our analytics stack (see the data discovery and metadata management section later in this post 👇). Where possible we also include a data developer within data-generating teams.
Data Build Tool (dbt) #
dbt, made by dbt Labs, has become central to the way we interact with data at Monzo. dbt allows users to run models in a separate development environment. This is huge when working with data; to know you can quickly iterate and test in a sandpit environment without impacting production data. You can tell dbt is a successful part of our platform when not only our data team is using the tool, but also our software engineers and business analysts too. It hasn’t been a seamless experience though. Using anything at scale usually brings its fair share of technical challenges.
Speed of running dbt has been a real issue. Currently we have over 4700 models in our dbt project with ~600k lines of SQL. When you have engineers using something slow, inevitably you will end up with workarounds, like our go-lang re-write of the dbt command line tool. However, having multiple competing tools isn’t ideal either and we don’t plan to rival dbt Labs any time soon!
We forked dbt in 2019 and placed the setup in a Docker container. At the time this seemed like a good idea for the speed at which we wanted to get security and productivity features into our data workflows. Docker containers are great for consistency between local and production environments and help new Monzonauts get to grips with Monzo data.
We’ve built a few custom features including dbt upstream prod and indirect_ref.
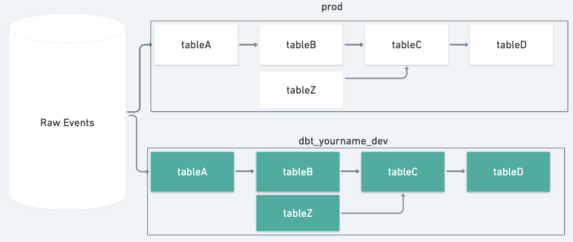
dbt upstream prod improves speed and saves money. When running dbt it is common to run with the upstream model operator dbt run -m +tableD. This command runs all of the data pipeline in your development environment up to the common source tables used in production. In the example below you can see this runs 5 models.

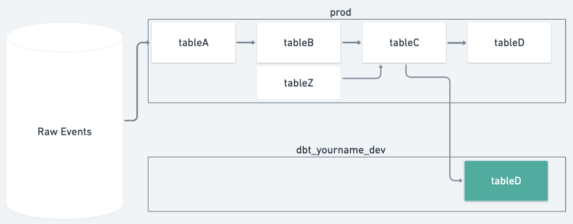
With our upstream production feature, the dbt run will read upstream dependencies from production tables. In this case, the same aim is achieved by running 1 model.

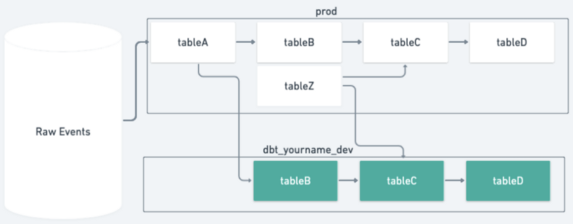
When a data developer is working on two tables of the data pipeline, our upstream feature intelligently figures out what part of the pipeline should be built in the development environment and which tables can be read from production. In the example diagram below, the developer has made edits to tableB and tableD. At the command line the developer enters upstream prod -m tableB tableD. Our upstream feature figures out tableC should also be run in the development environment because one of its upstream dependencies, tableB, has been modified.

indirect_ref helps us make sure Monzonauts only access the data they need. Some teams work with separate BigQuery projects where only a few people need to have access to that data. But how do we use aggregates or anonymous versions of that data? indirect_ref solves this problem by introducing the concept of 'interface tables' which sit at the end of a sensitive project’s data pipeline and act like an API dataset. The interface table is the only node that downstream consumers can access. Additionally, the interface table explicitly declares its downstream consumers. So if a downstream team uses the interface model, they will modify the dbt config in the interface model.
For example:

This explicitly forms a contract between the interface and consumer. As the interface model is owned by the team working with sensitive data, GitHub’s code owners automatically tags the producing team in the pull request.
Recently we did some benchmarking of how we could speed up dbt by a significant amount. We found:
- using an M1, the new Apple laptops with Apple’s own CPUs improved speed by 3x
- upgrading from dbt 0.15.0 -> 0.20.0 resulted in another 3x speed increase
- moving dbt out of a container resulted in a 2x speed increase for those using a Intel CPU MacBook Pro
Combining these will mean a 9x speed increase for Monzonauts with an M1 and an upgrade to dbt 😅
These benchmark results give us a good set of actions for our next project on dbt. We will move away from using Docker containers and refactor our customisations into plugins. We’d love to raise these as PRs on the dbt project or open source them as separate tools (👋 dbt!). Once we’ve refactored, we’ll upgrade to the latest version of dbt to gain the speed improvements and many features that have been added since v0.15.0.
Git CI/CD #
All our code is version controlled and we use GitHub for our code repositories. We use a mono-repo approach, which ensures consistency of tooling, CI checks and increases discoverability. Data developers test the code, but parts of the testing are also automated as part of CI so we can merge changes with confidence.
Our main challenge here using a mono repo has been the speed of CI checks. In the last year we reduced CI checks from ~30mins down to ~5mins. However as the complexity of our pipeline and number of models grow we will likely need to return to this as a problem. We also want to use CI/CD to start raising data standards. For example by setting minimum thresholds in our CI checks we can raise documentation, testing and metadata standards across Monzo.
Schedule orchestration #
We use Airflow to schedule, run and monitor the refresh of our data warehouse. Most of our models run on a nightly schedule, with some tables being ‘near real time’, rebuilding every 15 minutes. We use dbt to compile the Directed Acyclic Graphs (DAG) of data models, we then automatically convert this DAG to the format Airflow expects, a DAG of tasks.
Notifications #
If everything ran smoothly all the time that would be great, but it doesn’t! We make use of dbt model tags and a bit of Python glue work to post model run statuses to a #data-monitoring Slack channel. Here’s what that looks like in one of our model configs:

The Slack post tags the person who last modified the code and provides a few handy links to help resolve the issue.

With a penchant for automating the boring things, we have quite a few bots. Other notable examples are the core models bot that helps the data team keep track of the daily run of our most business critical tables. We also have a stale tables bot which scans for tables that haven’t been updated in a given period of time, then archives them and ultimately deletes them.
Airflow is a well-supported and widely-used Apache project that has served us well. However, managing a self-hosted instance is a single point of failure and regularly requires maintenance. To reduce the work with self-hosting we will likely move to using Google Cloud Composer in 2022.
Data discovery and metadata management #
Data discovery is a more nascent component of the modern data stack. We’ve been using dbt docs — however with >4700 models the manifest.json and catalog.json is >300mbs, so the user experience isn’t great, particularly in the remote environment where some users may have slow internet. Part of our data governance is to have accountability for datasets: who should I contact regarding this dataset?
The Data Platform Engineering team is currently working on a solution to collect, store and surface metadata in an accessible way. We want to:
- make our end to end data discoverable — our event data sits outside of dbt docs until it gets consumed into a data pipeline, but how do you discover the events in the first place?
- have a single interface to consume the metadata, for example Amundsen, Marquez or DataHub
- make sure metadata doesn’t only apply to assets in our data warehouse — it also includes our backend database (CassandraDB) and our visualisation assets (charts and dashboards)
Cloud compute / data warehouse #
A data platform needs a database. Google Cloud Platform (GCP) is a crucial part of Monzo’s data platform. BigQuery, is GCP’s serverless, highly scalable, and cost-effective multi-cloud data warehouse. At our scale, we pay a significant amount to Google every month so we are constantly working on ways to reduce our bill. Sometimes these are as easy as a configuration change for a model to execute in a different BigQuery project, or helpful tooling that detects these opportunities and notifies the data team of them. Other times it can involve a complete analytics engineering rethink of our data models (some are ~60 terabytes rebuilt daily).
For more information, check out this case study from Google on how we use BigQuery for analytics.
Data visualisation #
We use Looker for all of our dashboards. With automations like reports being sent to slack channels when particular conditions are met, Looker helps make Monzo a data-driven organisation. What struck me when joining Monzo was that the main company Key Performance Indicators (KPIs) were sent out to every employee every week. I’d never seen such transparency with a company’s performance. One of Monzo’s values is to default to transparency and with this transparency brings a focus on the key outcomes we want to achieve. By default, everyone who works at Monzo has access to Looker and over 80% of our staff are active users.
A small amount of custom data visualisation occurs in Google Sheets and in Google Colab (Google’s hosted Jupyter notebook solution).
The main challenge has been the responsiveness of Looker at our scale. Despite Looker’s importance, nobody in the company owns it explicitly. This has resulted in continual degradation of cleanliness, structure and speed over the last 4 years. To date we have run a couple of ad-hoc projects to optimise Looker cleanliness and loading for end users. We’ve also created automation scripts to clean up broken dashboards, charts and detect columns in LookML that no longer exist.
Machine Learning platform #
The Machine Learning (ML) platform deserves a separate Machine Learning Infrastructure blog post — watch this space! Briefly, our ML stack broadly sits at the intersection of Analytics Infrastructure (GCP), where we house and analyse our data, and the Backend (AWS), where we deploy our business logic. Our long-term strategy is to enable data scientists and backend engineers alike to safely and easily use machine learning as a tool, where appropriate, across the entire spectrum of problems we are tackling at Monzo.
Some organisations have data scientists make predictive models and once happy with them, software engineers then need to reimplement them in the production code base. At Monzo we decided this would slow the deployment of ML too much. So we built scripts that template a Python ML microservice using Sanic as the API webserver that our data scientists and ML engineers can use to deploy to production. We also use CoLab for quick and dirty exploration.
Influenced by Feast’s architectural overview, the Feature Store is a common component for production ML that automates the journey of shipping features between our analytics (BigQuery) and production (Cassandra) databases. For a detailed writeup on this component see Neal’s post on the topic.
For more information on ML at Monzo see these posts:
Recommendations #
Finally, if you’re interested in reading more on the topic, we love the thought leadership on modern analytics tooling from Tristan Handy in the analytics roundup and accompanying podcast, Benn Stencil’s substack, Martin Fowler (in particular the Data Mesh post by Zhamak Dehghani), and the Data Engineering Podcast to mention a few.
If you’re interested in working for the data team at Monzo, we’re hiring!
✍️ Want to suggest an edit? Raise a PR or an issue on Github